Score Ratio Value Plots
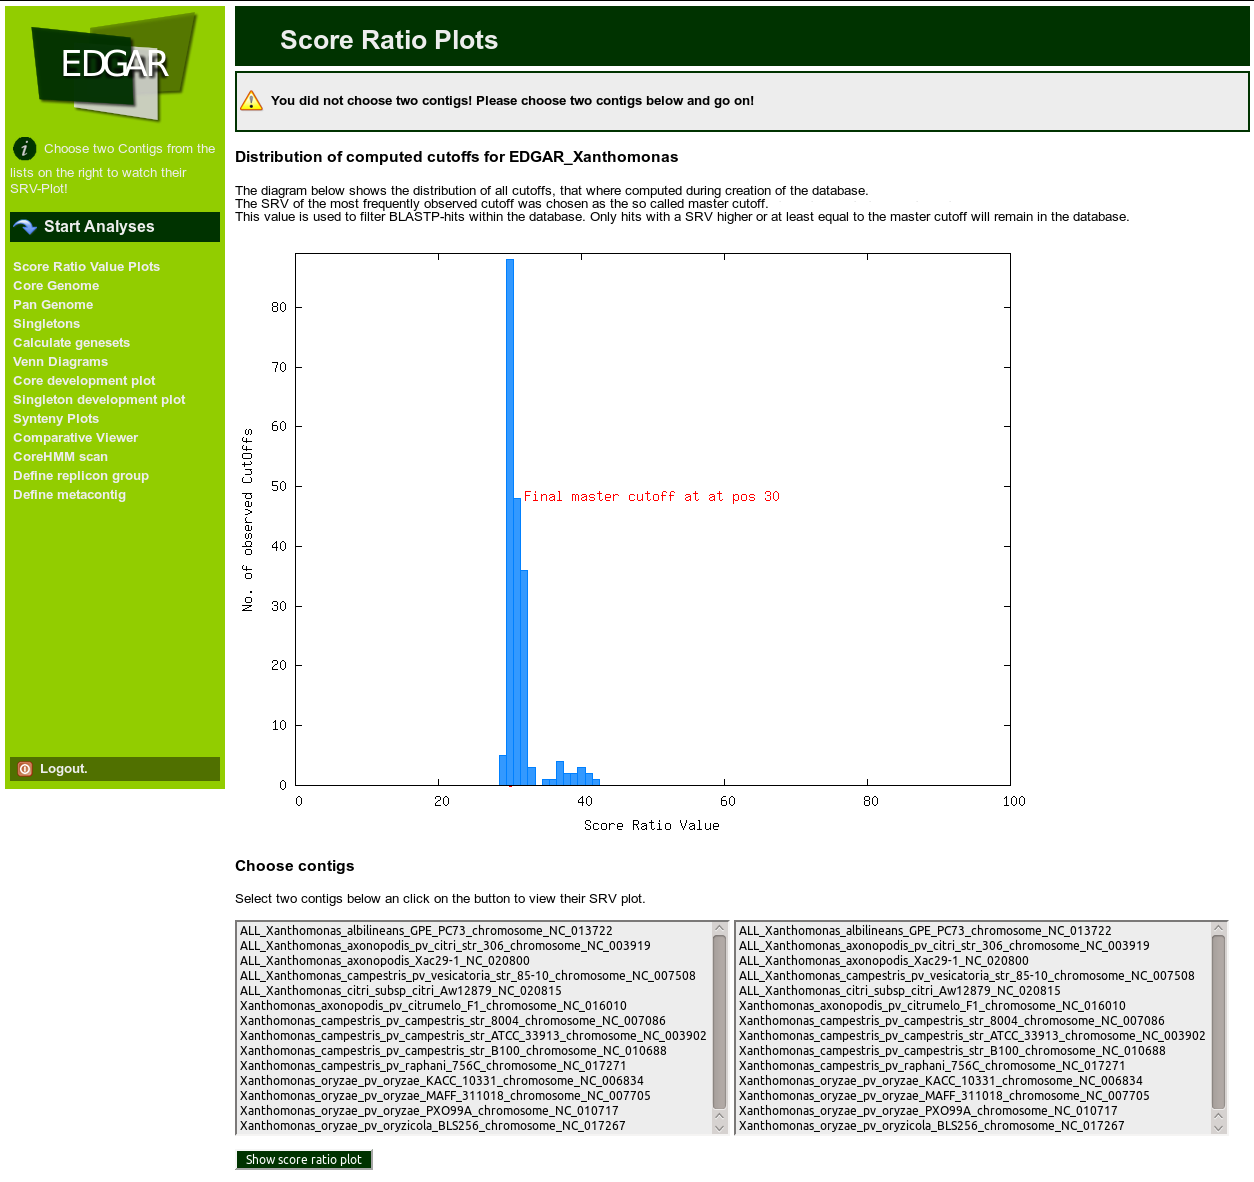
This feature of the EDGAR web server allows you to observe the Score Ratio Value (SRV) statistics that are used to generate an orthology cutoff for each project.
The SRV plot page shows the histogram of all pairwise cutoffs and the resulting overall cutoff in the upper part of the page. In the lower parts you can select two genomes to display the SRV histogram for the selected pair. For details on the orthology calculation please have a look at the respective documentation page.

