Synteny plots
Synteny plots show the conservation of gene order among genomes and clearly show large scale evoluationary events like genome rearrangements.
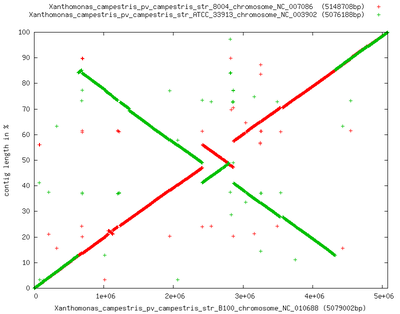
Synteny describes the physical co-localization of genes on a chromosome. The synteny of genes is a good phylogenetic indicator, as during evolution the ordering of genes is changed by rearrangement events like inversions, deletions, insertions or translocations. Hence, for organisms that are closely related a higher conservation of gene order is expected than for more distantly related organisms. EDGAR provides an interface to create synteny plots of pairs of genomes. A reference organism can be compared to one or a number of other genomes. The resulting synteny plot shows the position within the reference genome on the x-axis, while the y-axis shows the relative position within the compared genome. Dots in the plot reflect the stop positions of genes that were found to be orthologous to each other. If several genes are selected, the respective positions will be plotted in different colors. The following image shows a plot of one reference compared to two other genomes.

